

Your support inbox can warn you about chargebacks before your payments dashboard does.
You see the same patterns every week. A customer asks where their order is. Another says the item looks different from the photos. Someone wants a refund and gets a delayed reply. A few days later, those same conversations come back as disputes. That's why customer service kpis matter more than most Shopify merchants think. They're not just support metrics. They're early warning signals for lost revenue.
For stores dealing with fraud, delivery issues, and friendly fraud, support performance sits very close to the money. If your team answers slowly, resolves poorly, or misses repeat complaint patterns, the problem doesn't stay inside support. It turns into refunds, reversals, chargebacks, and margin pressure.
Your Support Inbox Is a Goldmine or a Landmine
A lot of merchants treat support as a cleanup function. Orders go out, ads run, customers buy, and the support team deals with whatever breaks. That mindset gets expensive fast.
In practice, the support inbox tells you what's about to happen next. If shipping tickets suddenly pile up, you may be heading toward "item not received" disputes. If product quality complaints keep reopening, "product not as described" claims usually aren't far behind. If your agents keep giving partial answers, customers stop waiting and go to their bank.
What the inbox is really telling you
Every ticket has two possible outcomes.
One, your team solves the issue clearly and quickly. The customer stays with you, or at least accepts the outcome. Two, the issue drags on, trust drops, and the customer starts looking for another way to get their money back.
That's why I look at support data as both an operations function and a revenue protection function. The same inbox that helps you save a sale can also help you prevent a dispute.
A practical way to view this:
- Shipping complaints often point to fulfillment gaps, tracking confusion, or weak proactive communication.
- Refund arguments often point to policy friction, not just unhappy customers.
- Product mismatch tickets often reveal listing problems, bad expectations, or supplier quality issues.
- Duplicate contacts usually mean the first answer didn't solve anything.
Practical rule: If the same issue shows up in support more than once, treat it as a process problem, not an agent problem.
This also explains why general customer service advice can overlook the unique challenges of e-commerce. A store owner requires more than "better support." You need a support operation that reduces dispute risk and protects contribution margin. If you want a solid foundation for that work, these customer service best practices for ecommerce teams are a useful place to refine the basics before you begin measuring.
Revenue protection starts before the dispute
By the time a chargeback lands, you're already reacting. The better move is to catch the issue while it still sits in support.
That means watching which conversations resolve cleanly, which ones stall, and which categories are getting worse week over week. Merchants who do this well usually don't treat support as a soft metric. They use it as a control panel for churn, fraud pressure, and chargeback exposure.
Why Standard Customer Service KPIs Fail E-commerce Stores
A KPI is just a measurable way to track whether a process is healthy or not. For support, that usually means asking simple questions. Are customers getting answers fast enough? Are issues resolved? Are people happy after the interaction?
That's useful, but it's incomplete for Shopify stores.
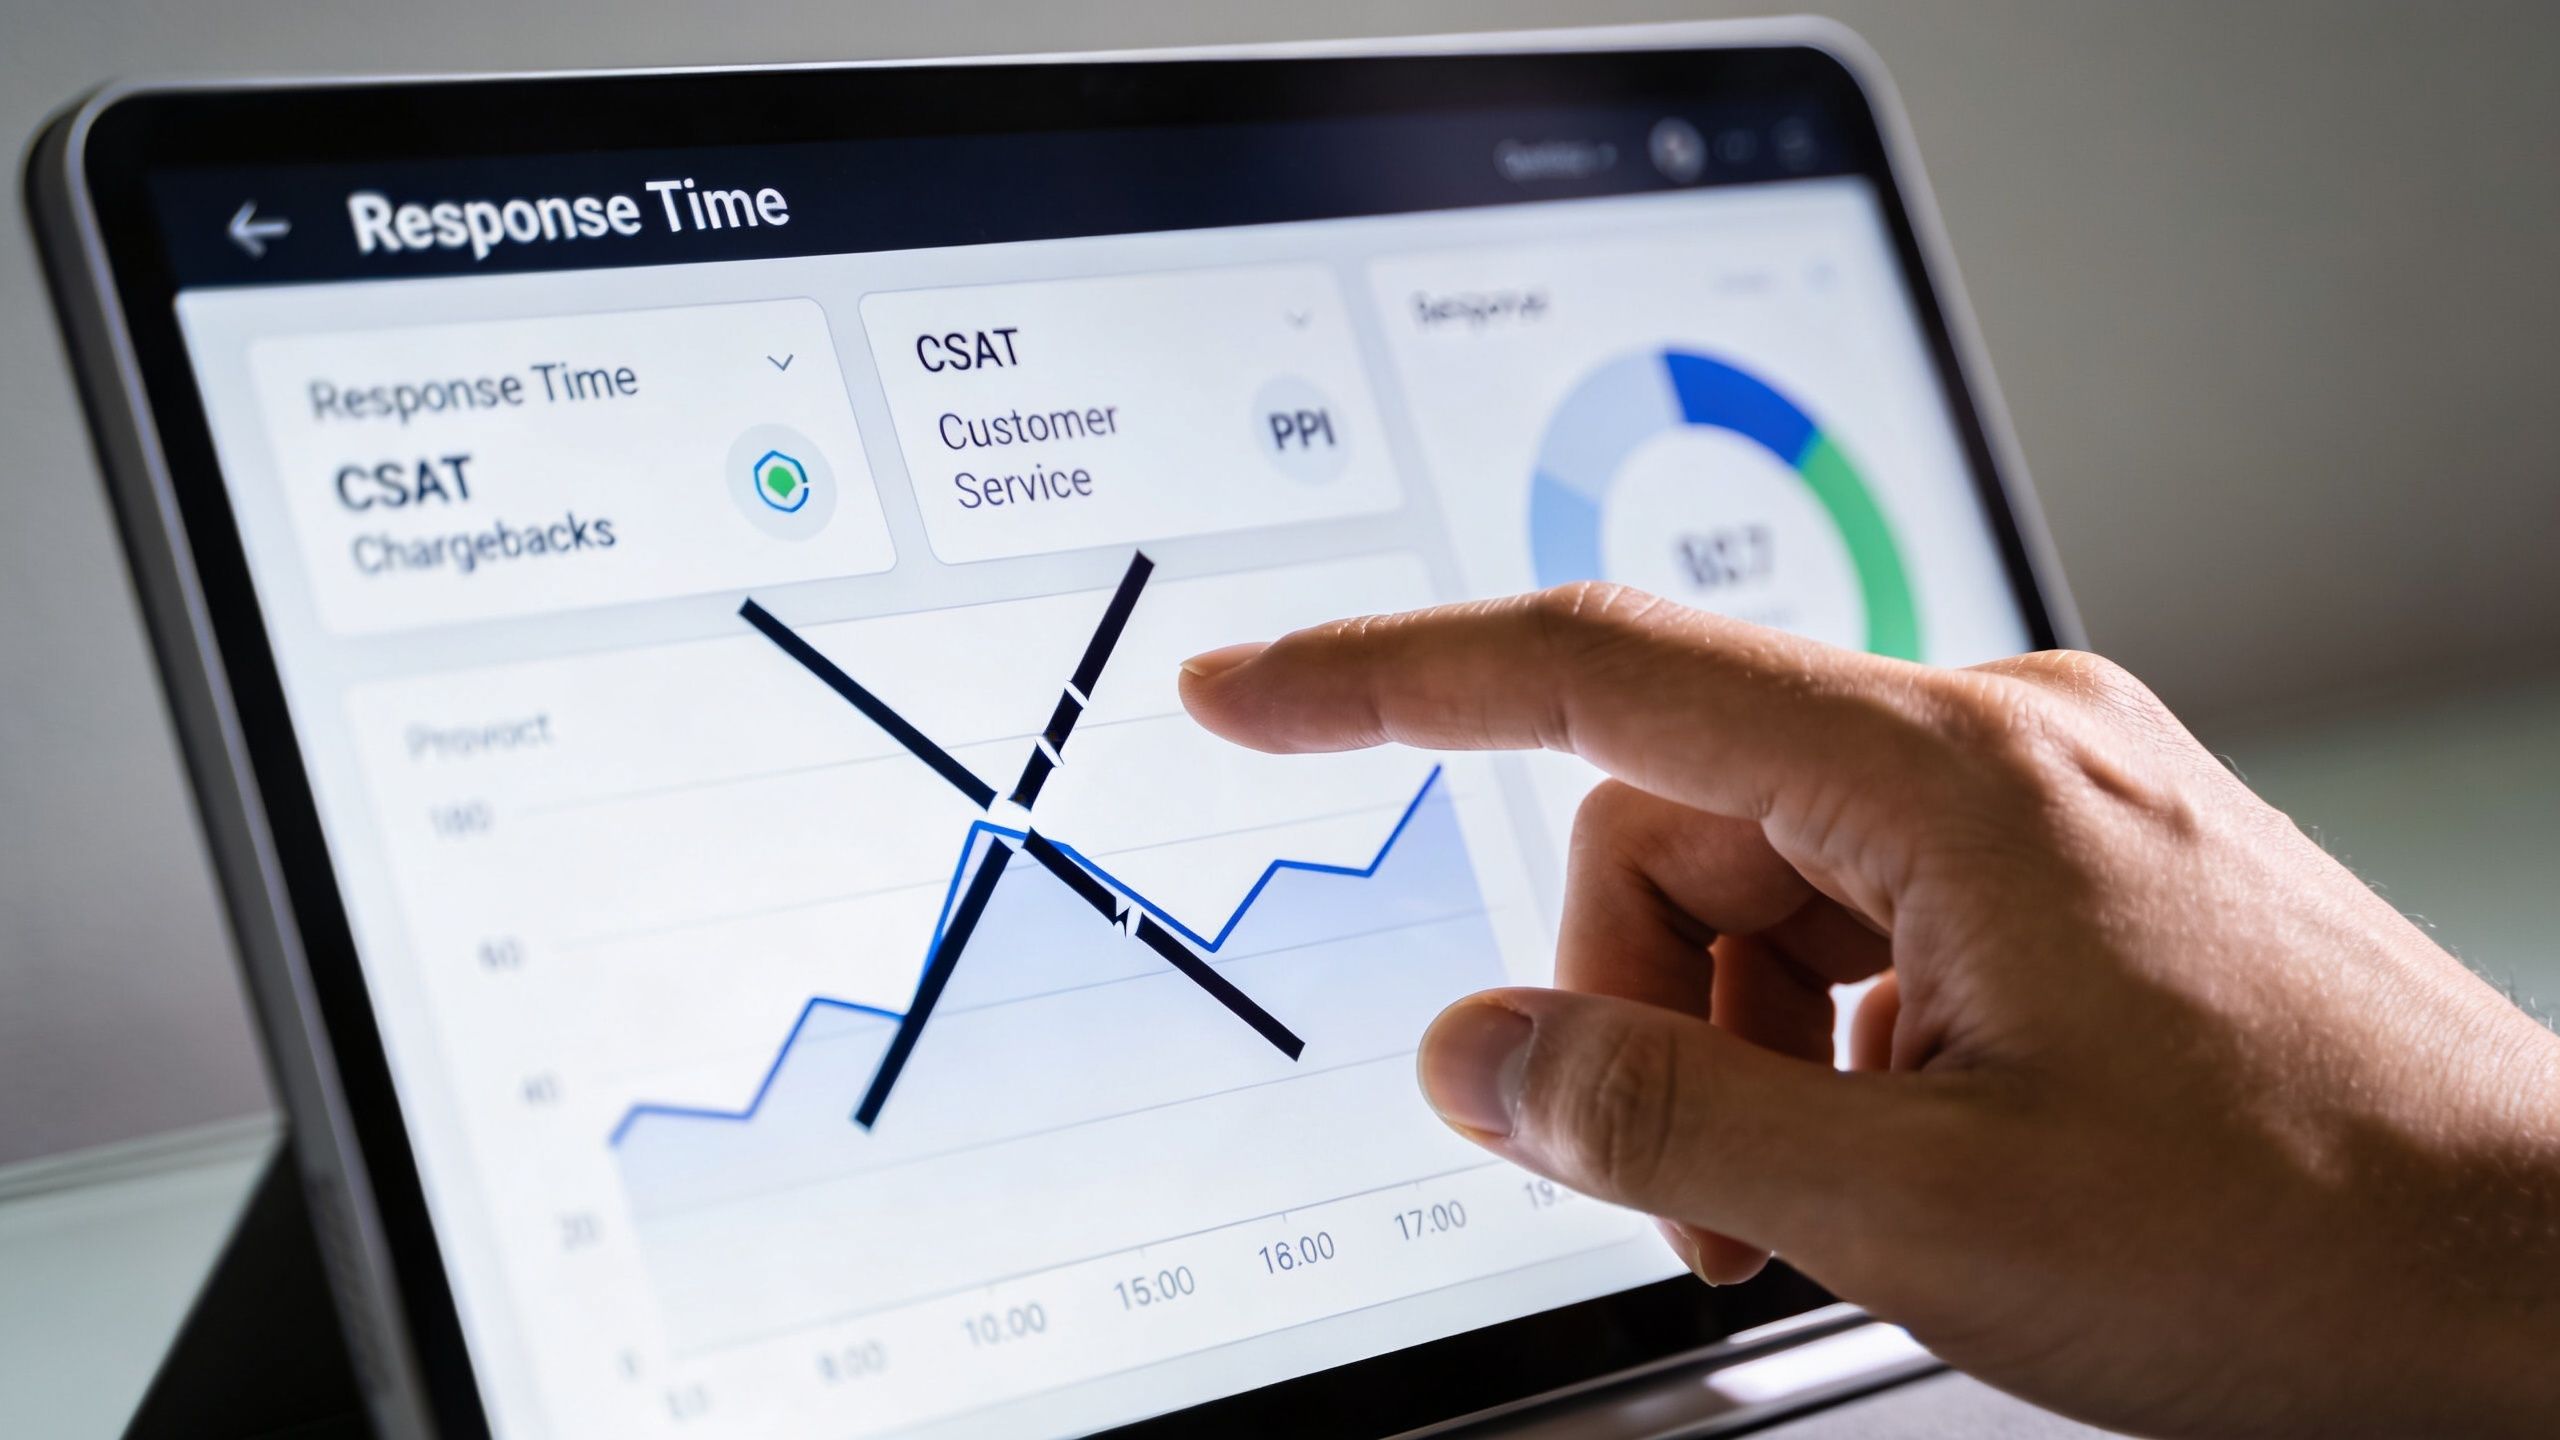
Generic support advice misses dispute risk
Most articles about customer service kpis were written for support teams in a general sense. They focus on satisfaction, response times, and loyalty. Those matter, but they don't tell an e-commerce operator enough about chargeback exposure.
As GoodData's overview of customer service performance indicators points out, mainstream coverage of customer service KPIs almost completely ignores metrics for fraud and dispute scenarios. Standard guides don't address the needs of merchants fighting chargebacks, who need to measure dispute win rates, evidence submission speed, and friendly fraud detection accuracy.
That gap matters because e-commerce support works under different pressure than a normal service desk. A missed refund conversation can become a payment dispute. A slow reply on delivery can become a bank claim. A weak order history can leave you without the evidence needed to fight back.
Vanity metrics versus revenue protection metrics
Some metrics look good in a report and still fail to protect your store.
A broad loyalty score might tell you how customers feel about your brand over time. It won't tell you whether your support team is defusing the exact issues that turn into chargebacks. For most Shopify operators, the more useful question is this: which metrics help me spot dispute risk early enough to act?
Use that filter when you build your dashboard.
- Keep metrics that expose friction. Repeat contacts, unresolved shipping tickets, and refund delays usually point to future cost.
- Keep metrics that show proof quality. If your records are messy, dispute response gets harder.
- Drop metrics that sound strategic but don't change action. If a number doesn't help you reroute staffing, fix policy, or prevent a dispute, it doesn't deserve top billing.
If fraud pressure is part of your day-to-day, support and risk operations start to overlap. Teams that want fewer preventable disputes usually tighten support workflows alongside their ecommerce fraud prevention process, because customer confusion and fraud claims often arrive through the same inbox first.
Customer service kpis matter most when they help you decide what to fix this week, not when they make last month's report look polished.
The 4 Core KPIs Every Shopify Merchant Must Track
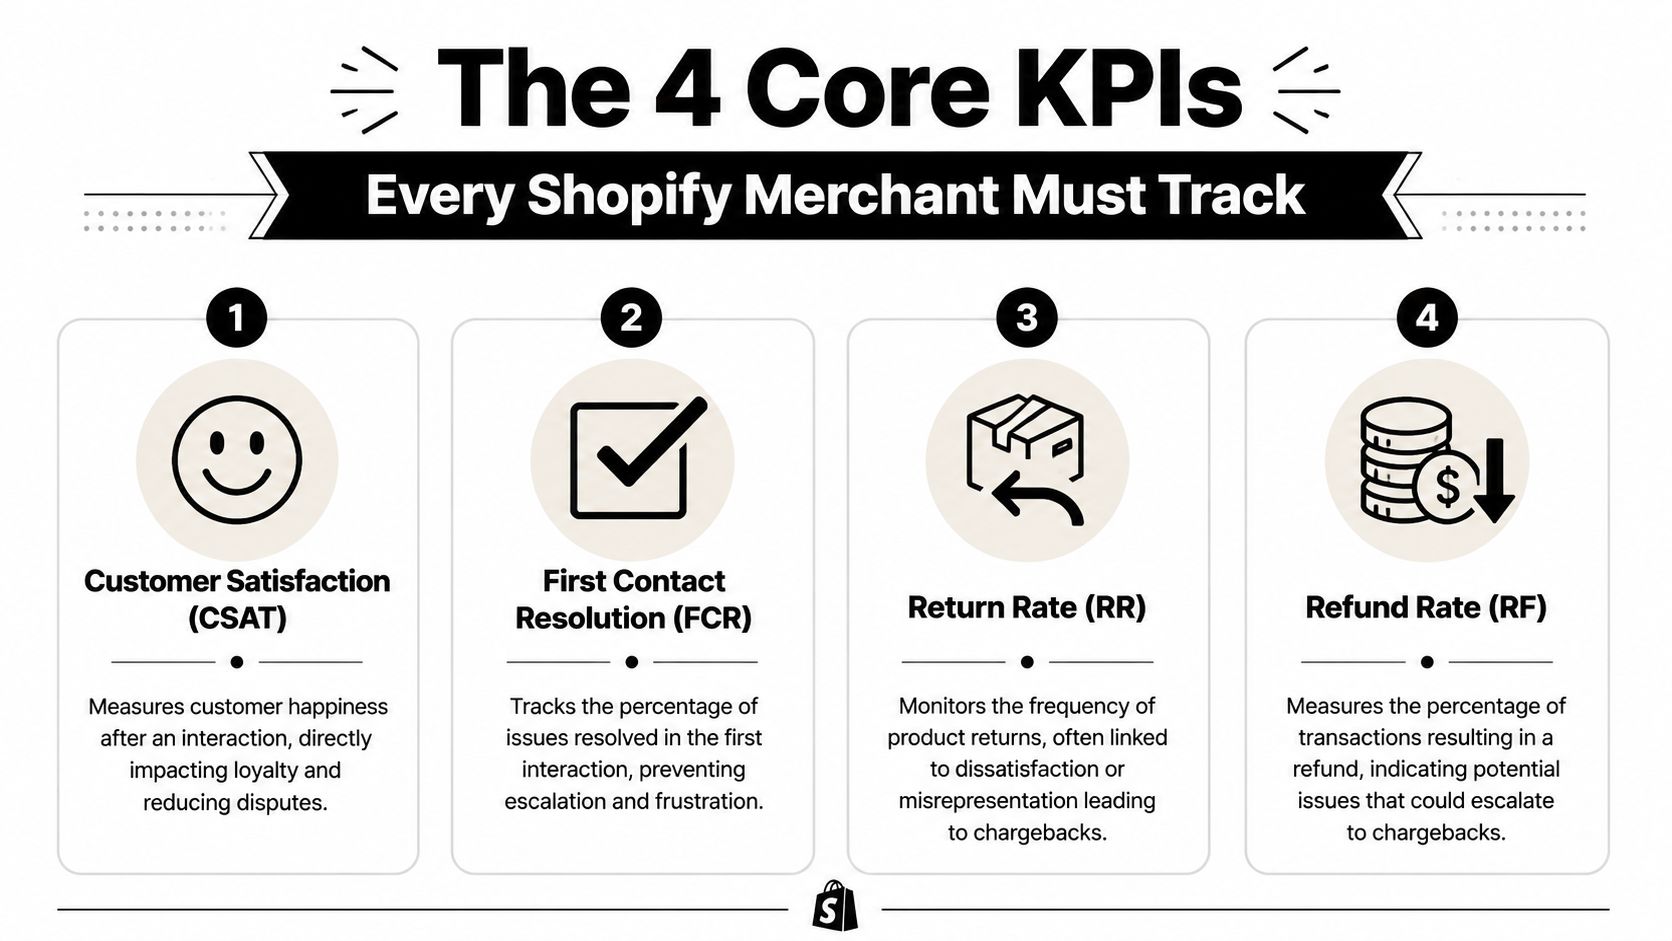
A Shopify support team does two jobs at once. It answers customer questions, and it catches the problems that turn into refunds, disputes, and lost margin. If you only track a few customer service kpis, track the ones that show whether support is reducing chargeback risk or letting it build.
Chargeback prevention KPIs at a glance
| KPI | How to Calculate | Good Benchmark | What It Signals |
|---|---|---|---|
| CSAT | (Number of satisfied responses / Total responses) x 100 | High-performing teams often land around the mid-80s or higher | Whether customers leave the interaction satisfied or frustrated |
| FCR | Total number of one-touch tickets / Total number of tickets received | Top-performing teams reach 70-75% | Whether issues are solved before they escalate |
| Average Resolution Time | Total time needed to solve all tickets / Total number of tickets solved | No universal number here. Track by ticket type and trend. | Whether customers are waiting long enough to lose confidence |
| Ticket Volume by Type | Tag and count tickets by reason | No universal number here. Watch for spikes and repeats. | Which issue categories are most likely to create dispute waves |
These four metrics are enough to manage the risks.
CSAT shows whether support defused the problem
Customer Satisfaction Score, or CSAT, measures how customers felt after a support interaction. The standard formula is (Number of satisfied responses / Total responses) x 100. Industry benchmark roundups, including the Customer Thermometer guide to customer service KPI benchmarks, place strong CSAT performance in the mid-80s or above.
For a Shopify store, that score matters because low satisfaction often means the customer still feels unresolved. In e-commerce, unresolved feelings become expensive. A shopper who leaves angry after a shipping, refund, or product-quality ticket is much more likely to file a bank dispute than wait for another reply.
Use CSAT in a way that helps operations, not just agent reviews.
What works:
- Send the survey right after resolution
- Break CSAT out by ticket tag, especially shipping, damaged item, refund request, and billing
- Read the written comments, because that is where policy confusion and fulfillment failures show up first
What does not work:
- Rolling every channel into one average
- Using CSAT only to rank agents, when the root cause may sit in product pages, warehouse accuracy, or refund policy
FCR tells you whether the first reply closed the loop
First Contact Resolution, or FCR, tracks the percentage of tickets resolved in the first interaction. The formula is Total number of one-touch tickets / Total number of tickets received. Top-performing support teams reach 70-75%, according to Zendesk's customer service KPI guide.
This metric matters more in e-commerce than many support leaders admit. A first reply that includes the right tracking detail, refund steps, or subscription explanation can stop a claim before it starts. A weak first reply creates a second contact, then a third, then a customer who decides the bank will be faster.
I watch FCR most closely on high-risk queues:
- Where is my order
- Refund status
- Damaged item
- Unauthorized charge
- Subscription cancellation
Low FCR in those categories usually means support is acknowledging the issue without resolving the risk.
Average resolution time shows where trust starts to slip
Average resolution time is simple. Add the total time it took to solve tickets, then divide by the number solved.
The mistake is using one storewide target. Shipping questions, product defects, subscription billing problems, and fraud reviews do not move at the same pace. What matters is whether resolution time is rising in the ticket types that most often end in lost revenue.
A practical setup is better than a polished one:
- Track resolution time by tag
- Separate time waiting on the customer from time waiting on your team
- Review open refund and delivery tickets every week
- Flag aged tickets that involve money, replacement requests, or carrier exceptions
Slow resolution on a sizing question is annoying. Slow resolution on a missing package or pending refund can turn into an "item not received" or "credit not processed" dispute.
Ticket volume by type points to the operational leak
This KPI looks basic, but it is usually the one that saves the most money.
Tag tickets by reason and review the trend every week. If "where is my order" jumps, the problem may be carrier delays, late fulfillment, or weak delivery expectations on the product page. If "item not as described" rises, check your listings, images, and supplier consistency. If "refund not received" keeps showing up, support is not the main issue. Your refund process is.
That is why this metric matters. It helps you spot the source of preventable chargebacks before finance sees the loss.
A simple weekly tag set:
- Shipping and tracking
- Refund and cancellation
- Product quality
- Billing confusion
- Fraud or unauthorized claim
- Subscription or recurring charge questions
If you want these numbers to drive action, connect them to a documented chargeback prevention process for Shopify merchants so support trends trigger fixes in fulfillment, policy, and dispute response.
From Metrics to Money Connecting KPIs to Chargeback Outcomes
A customer emails about a missing package on Monday. By Friday, they still do not have a clear answer. The next update you get is not from support. It is a chargeback for "item not received."
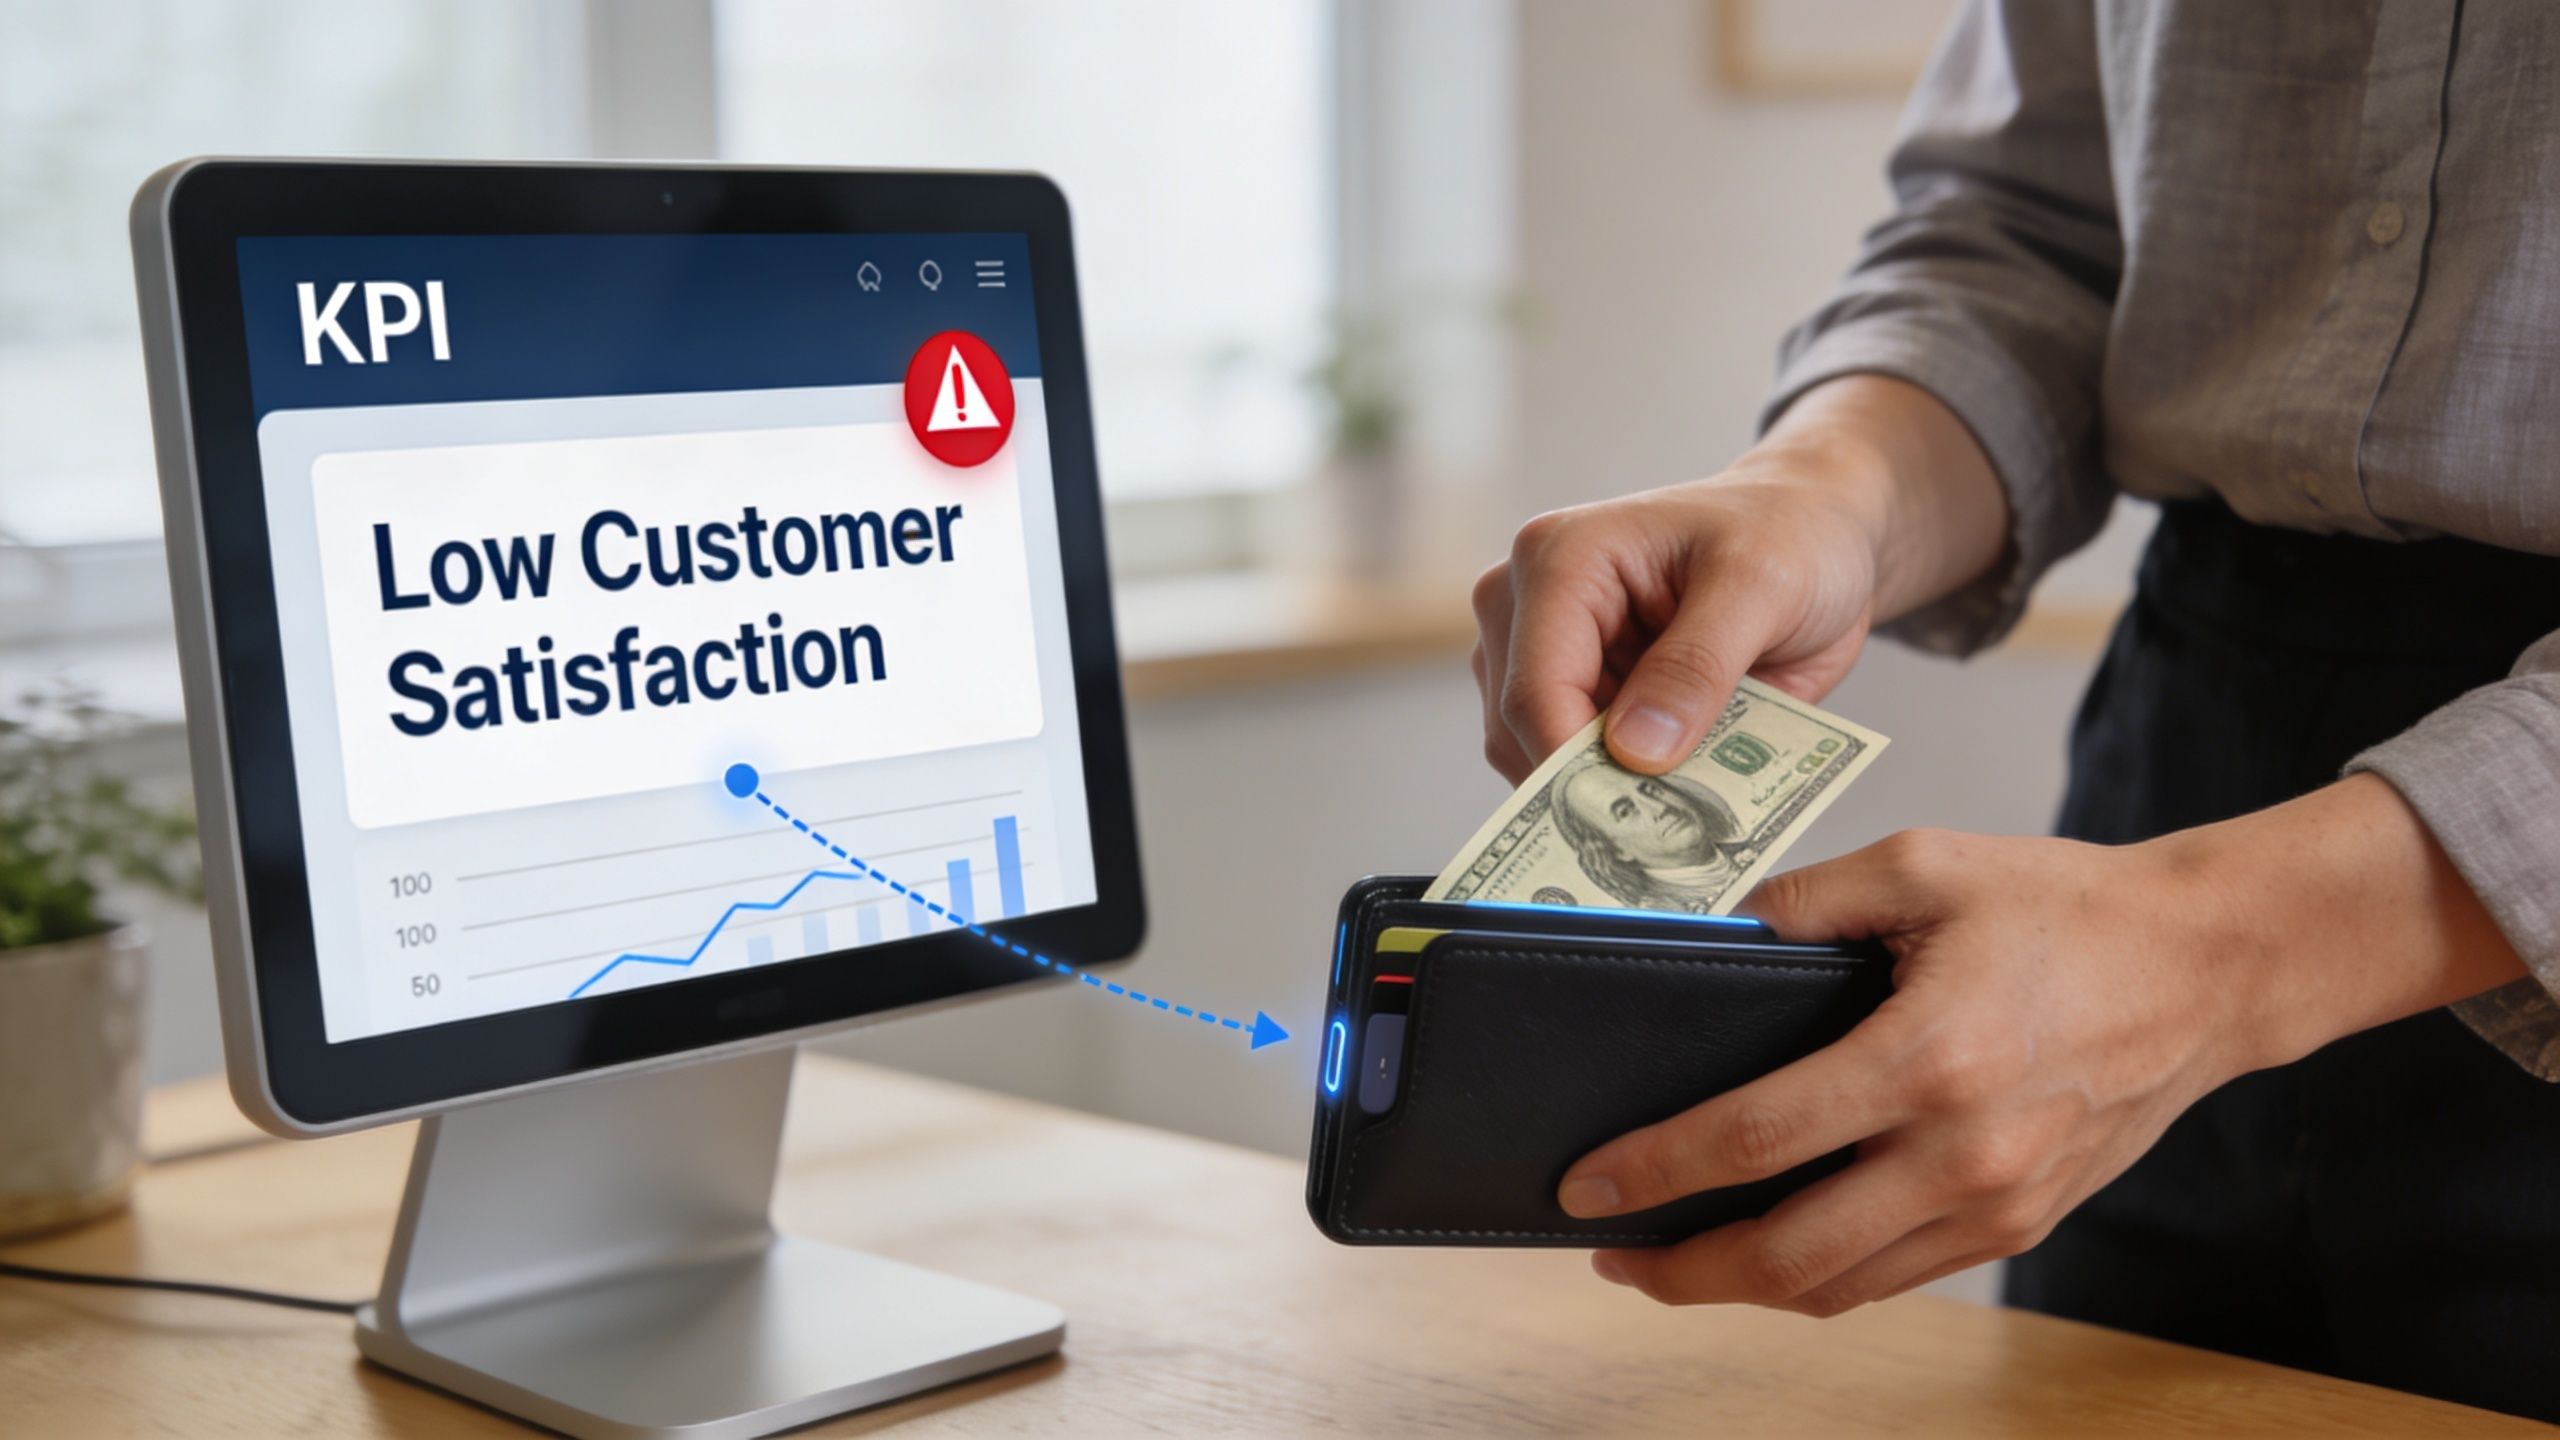
That is the connection merchants need to make. Support KPIs are not just service metrics. They are early warning signs for lost revenue, extra dispute fees, weaker processor relationships, and thinner margins.
The practical job is simple. Tie each support metric to the dispute reason it tends to create.
What a bad number usually turns into
CSAT is a good example. A weak score does not just mean customers are unhappy. In e-commerce, it often means they no longer trust your store to fix the problem. Once trust drops, more customers skip your process and go straight to the bank.
The pattern usually looks like this:
- Low CSAT on product quality tickets often shows up later as "not as described" disputes
- Slow resolution on shipping or delivery issues increases "item not received" risk
- Open refund tickets that drag on create "credit not processed" chargebacks
- A spike in billing confusion contacts often leads to unauthorized or recurring transaction claims
That sequence matters because every dispute costs more than the order amount. You lose revenue, pay fees, spend team time on evidence, and still may not recover the sale.
Support KPIs measure whether the customer still believes your team will solve the problem before their bank steps in.
Read KPI changes like a finance problem, not just a support problem
General support teams can stop at service quality. Shopify merchants cannot. The same metric has a different weight when every late refund, weak delivery explanation, or unclear subscription charge can turn into a dispute.
A rise in resolution time on low-stakes questions might only hurt customer experience. A rise in resolution time on orders, refunds, or billing issues threatens cash flow. That is the e-commerce lens most KPI guides miss.
If one queue starts slipping, check three things right away:
- What changed operationally? Carrier performance, warehouse backlog, stock accuracy, product quality, promo terms
- What changed in support handling? Macros, staffing, triage rules, escalation speed
- What proof are you collecting now? Tracking history, refund timestamps, cancellation records, and agent replies that explain what happened
The third point affects recovery as much as prevention. If the case later becomes a dispute, your support log often becomes part of the evidence set. Clean notes, consistent replies, and a clear order timeline make a real difference when you build a chargeback representment process that gives issuers a coherent story.
A quick walkthrough helps make the pattern obvious:
The expensive mistake
Merchants usually do not lose money because a KPI turned red once.
They lose money because the signal sat untouched until the monthly review.
Two weeks of slow refund handling can create a wave of preventable disputes. By the time finance reports the losses, the root cause is older, the evidence is weaker, and the profit is already gone.
Building Your Anti-Chargeback KPI Dashboard
You don't need a big business intelligence project to make customer service kpis useful. A simple dashboard inside your helpdesk is enough if it helps you spot risk early and act fast.
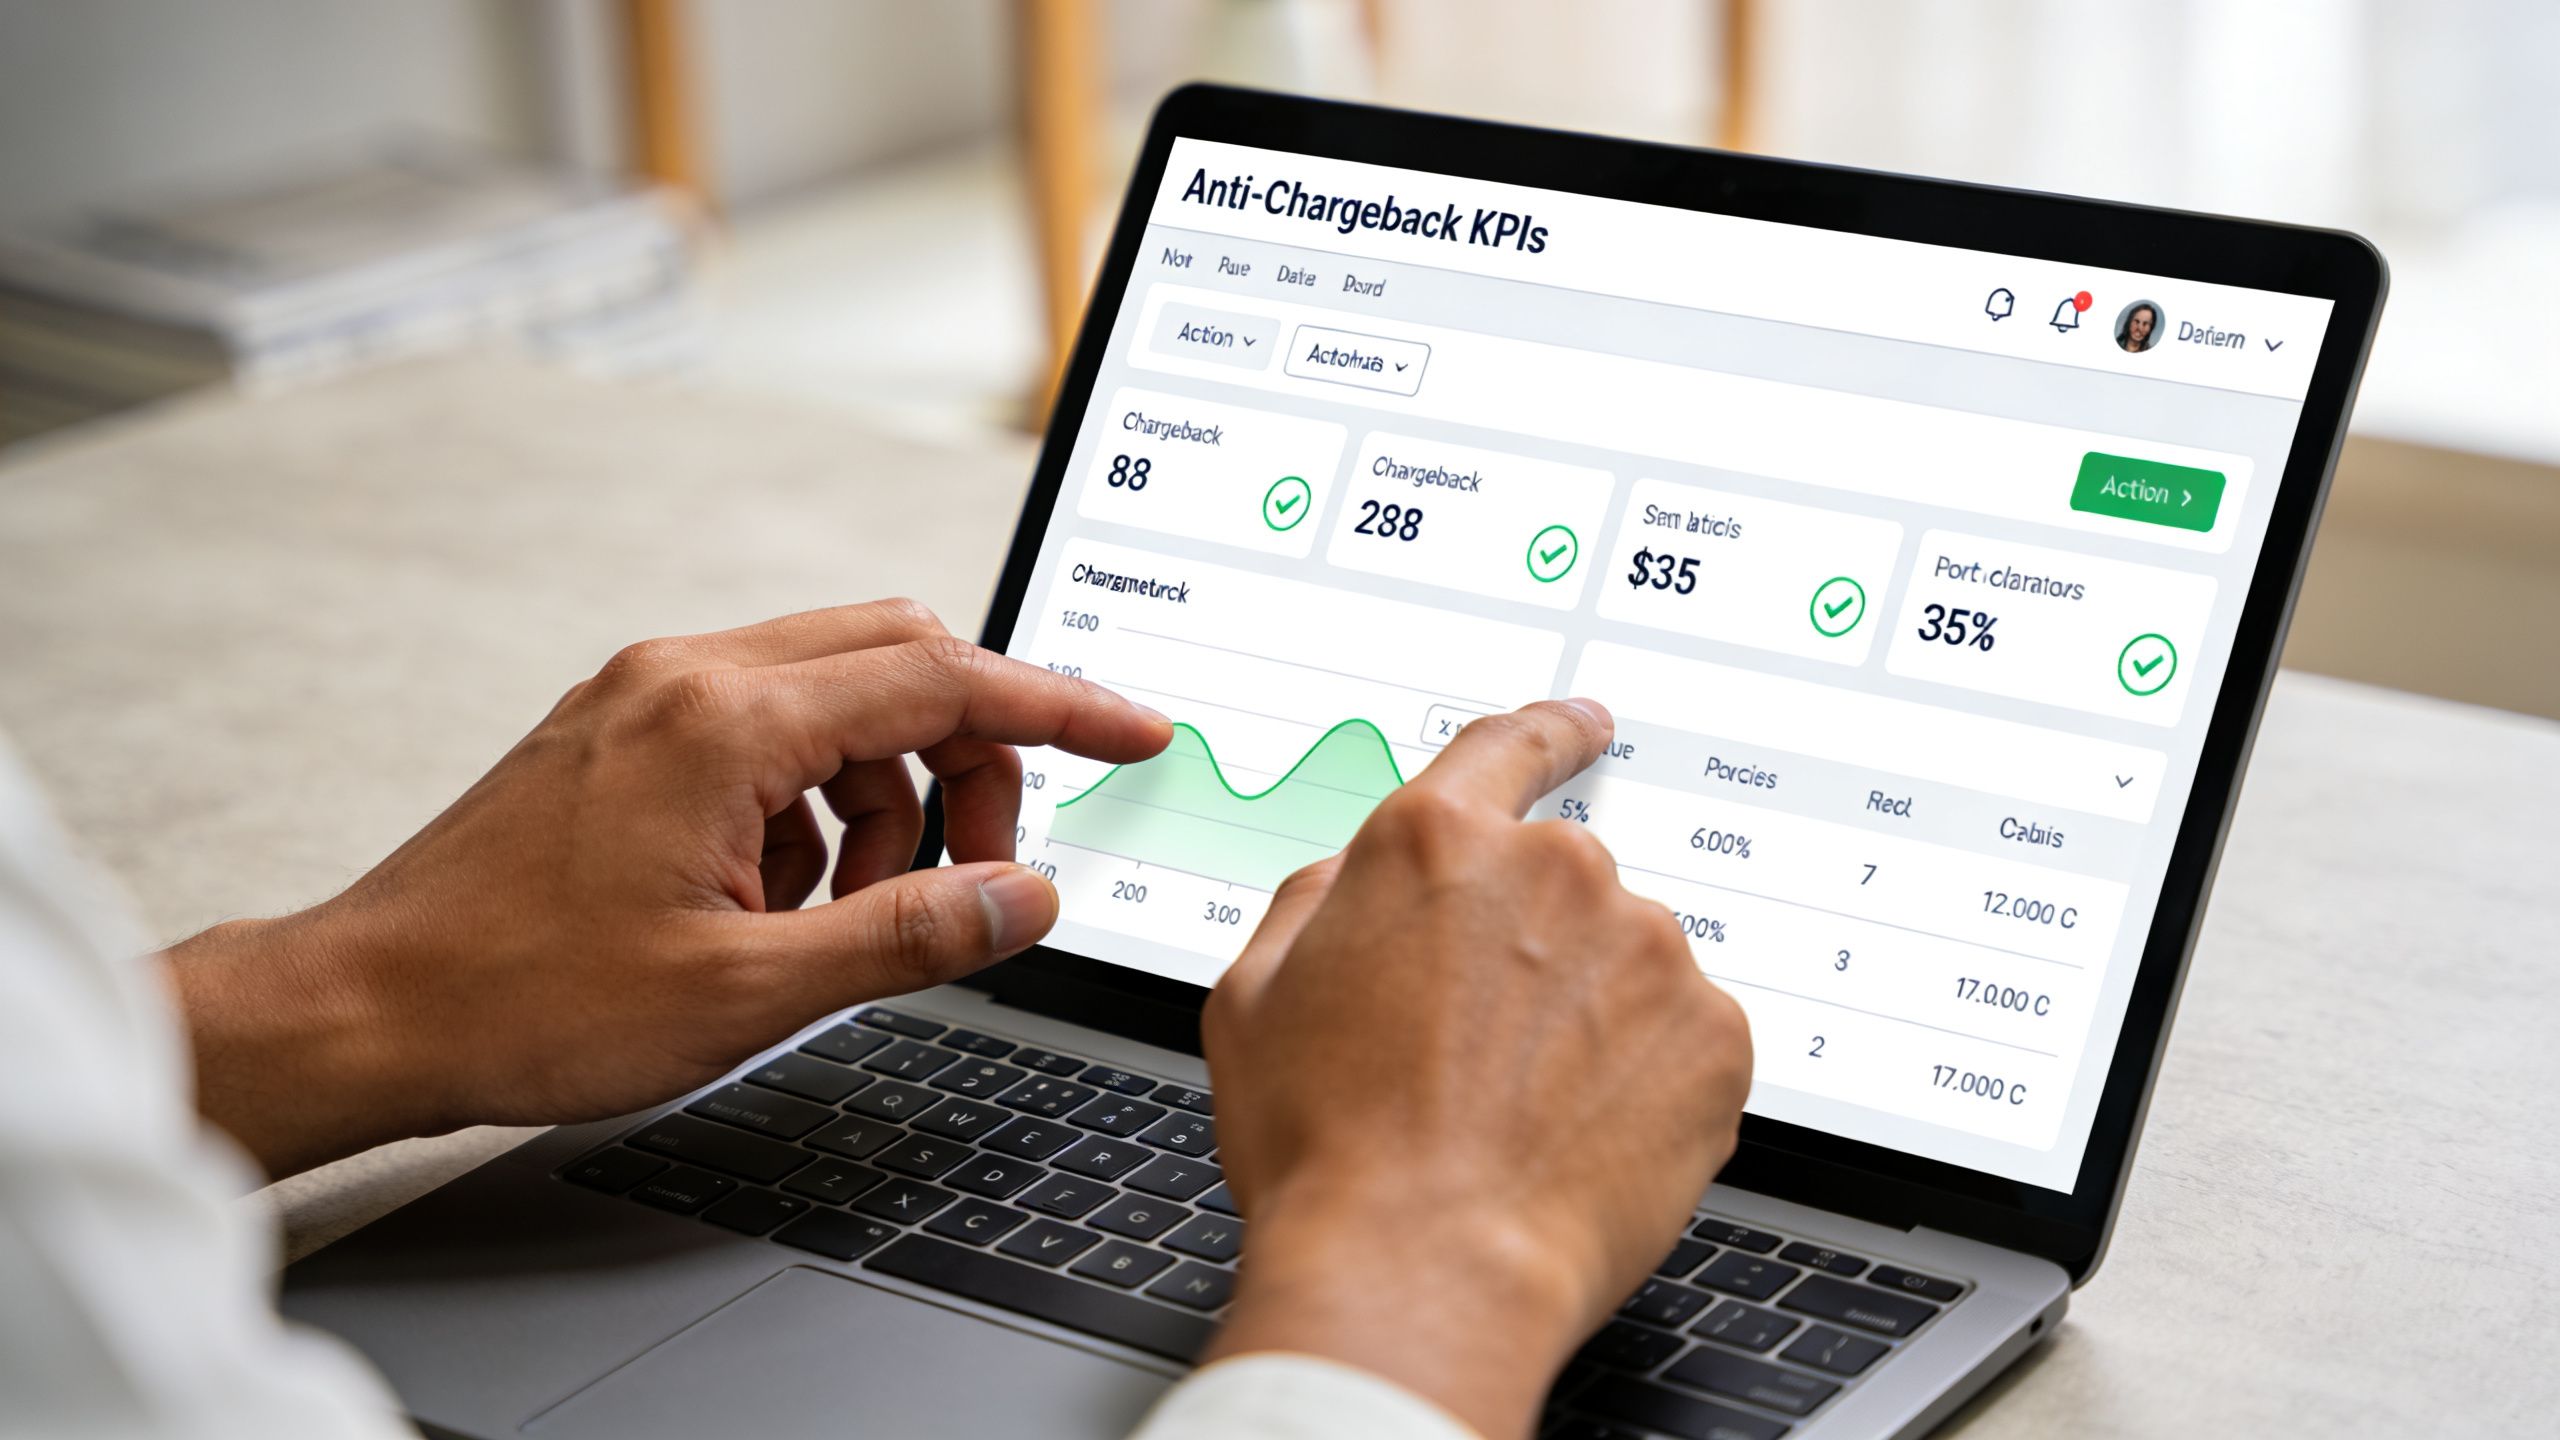
What to put on the dashboard
Use the tools you already have. Gorgias, Zendesk, Reamaze, and Shopify-adjacent support stacks all let you report on tags, resolution times, and satisfaction.
Keep the dashboard tight:
- CSAT by ticket type so you can isolate quality, shipping, and refund issues
- FCR by ticket type so you can see where first replies are failing
- Average resolution time by ticket type so complex queues don't hide urgent breakdowns
- Ticket volume trend by type so operational problems show up before disputes do
Add notes beside the numbers. Metrics without context create bad decisions. If shipping tickets jump because a carrier missed scans for two days, your team should record that directly on the dashboard review.
How to make it usable in real life
A dashboard becomes useful when someone owns it.
Assign one person to review it at a fixed cadence. For many stores, that's daily for large volume and weekly for smaller volume. Then decide what action follows each trigger. If shipping ticket volume spikes, operations checks fulfillment and tracking communication. If refund resolution slows, finance or support reviews policy bottlenecks.
A workable review routine looks like this:
- Check trend, not just snapshot. One bad day matters less than a bad direction.
- Compare categories, not blended averages. A healthy overall score can hide one dangerous queue.
- Look for repeat contact themes. They usually reveal script or policy problems.
- Tie every insight to an owner. If no one owns the fix, the dashboard turns into decoration.
Operator note: The best dashboard is the one your team actually reviews before the next dispute batch arrives.
For stores that want prevention plus recovery in one operating stack, some merchants pair helpdesk reporting with chargeback management tools built for Shopify. One example is ChargePay, which handles the dispute lifecycle from alert to submission and tracks outcomes while support data helps identify what to fix upstream.
Alerts beat reports
Weekly reporting is fine. Alerts are better.
Set alerts for sudden spikes in shipping tickets, repeated refund complaints, or any queue that starts aging badly. You're not trying to build a perfect reporting system. You're trying to catch the issue while customers still want help from you instead of their bank.
Stop Predicting Chargebacks and Start Winning Them
Most customer service kpis get discussed as service quality metrics. For a Shopify merchant, that's too narrow. These numbers tell you whether your store is creating confidence or creating disputes.
If your CSAT is weakening in the wrong ticket categories, that's not just a support issue. If FCR is poor on shipping or refund conversations, that's not just an efficiency issue. If ticket volume by type is shifting, that's not just reporting. It's a signal that revenue is at risk.
The practical takeaway is simple. Track the few metrics that expose friction early. Review them by ticket type, not just as blended averages. Treat support records as future dispute evidence. Then fix the process behind the trend, not just the symptom in the queue.
Even then, some chargebacks will still happen. Friendly fraud, issuer behavior, and customer abuse don't disappear because your support operation got better. Prevention lowers the number. It doesn't remove the need to fight the claims that get through.
That's where a second layer matters. Strong customer service kpis help you predict and reduce disputes. A disciplined dispute process helps you recover the money from the ones you couldn't avoid.
If you want both pieces working together, install ChargePay from the Shopify App Store. It has a Built for Shopify badge, a 4.9-star rating, and it automatically handles chargebacks with a 92.4% win rate across 200K+ cases, recovering $10.8M+ for merchants. You only pay when it wins.


.svg)



.svg)


.svg)
.svg)
.svg)